UseR! 2014
UseR! 2014 had a data visualization contest for the 2012 Programme for International Student Assessment (PISA). Some of the graphics generated for the contest are posted below. All plots and data processed in R using the ggplot2, dplyr, reshape2 packages and presented on this webpage using Rmarkdown. This contest was joint with Di Cook, Luke Fostvedt and Ian Lyttle.
In addition to the below plots, here are some random interesting discoveries I made from the data:
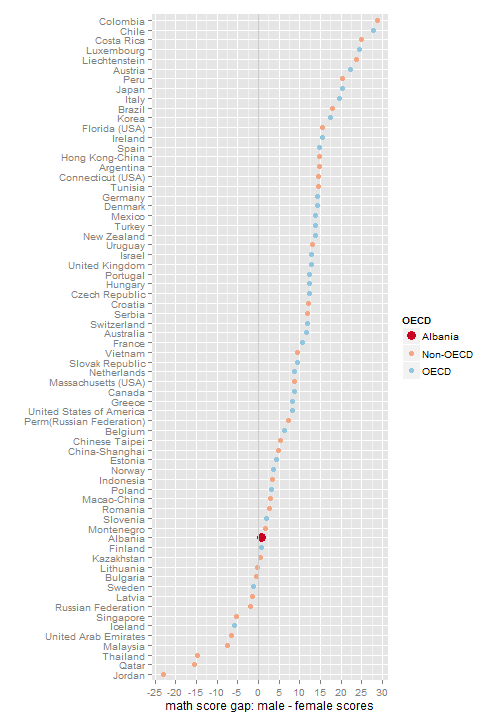
- Math test score gap in favor of males.
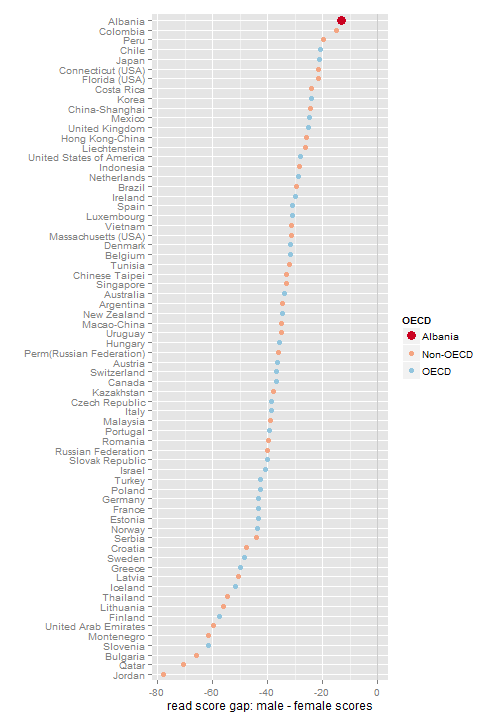
- Reading test score gap in favor of females.
- Students in single-parent households often had lower test scores if the parent was the father.
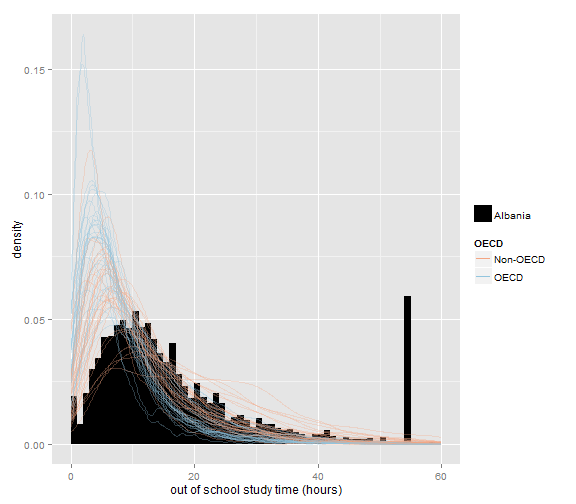
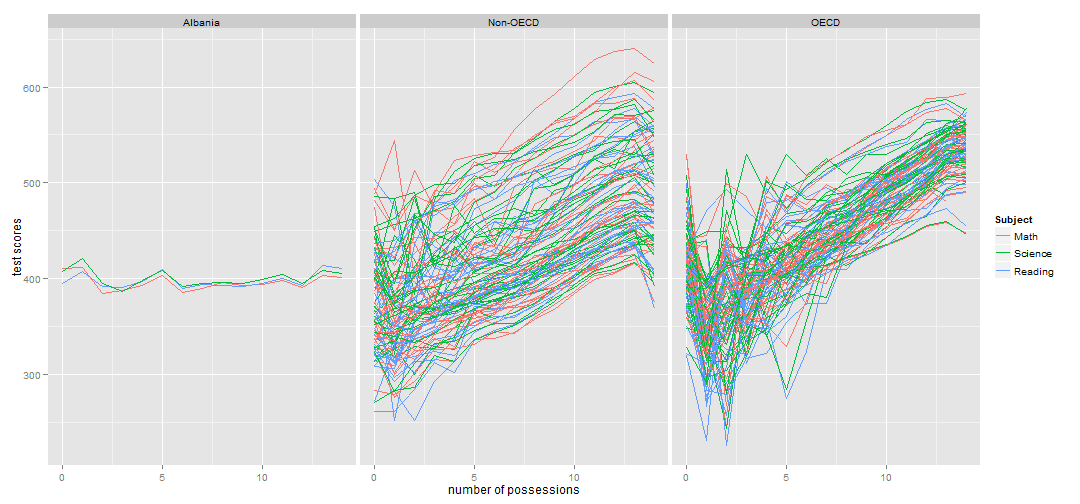
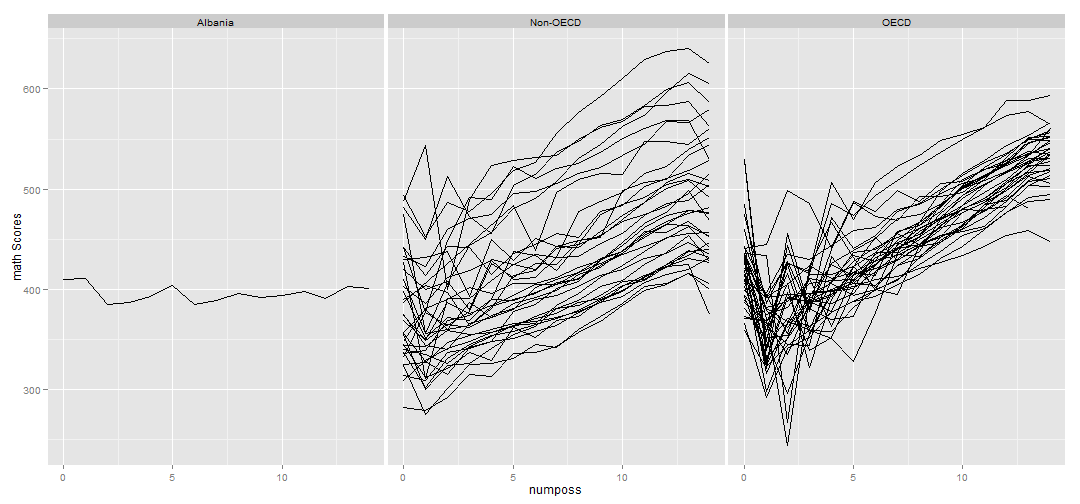
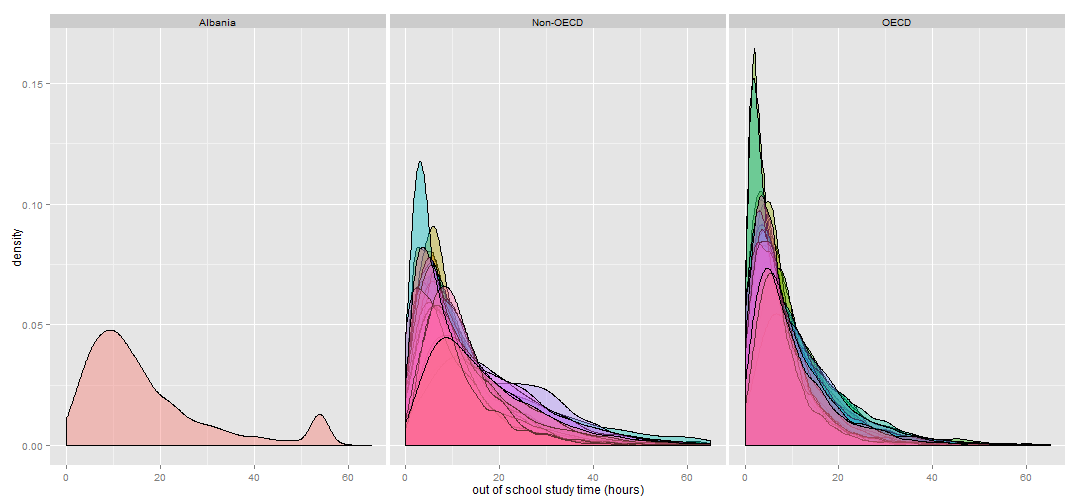
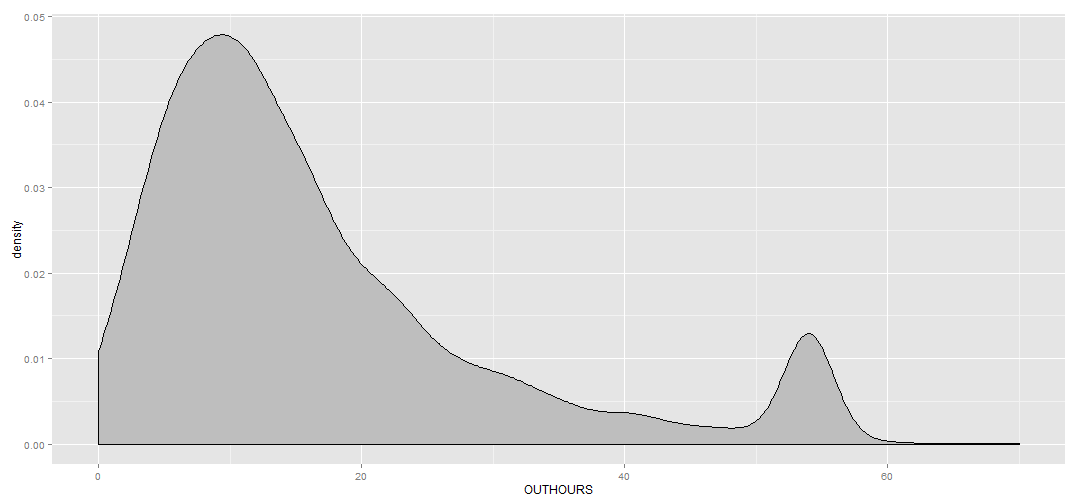
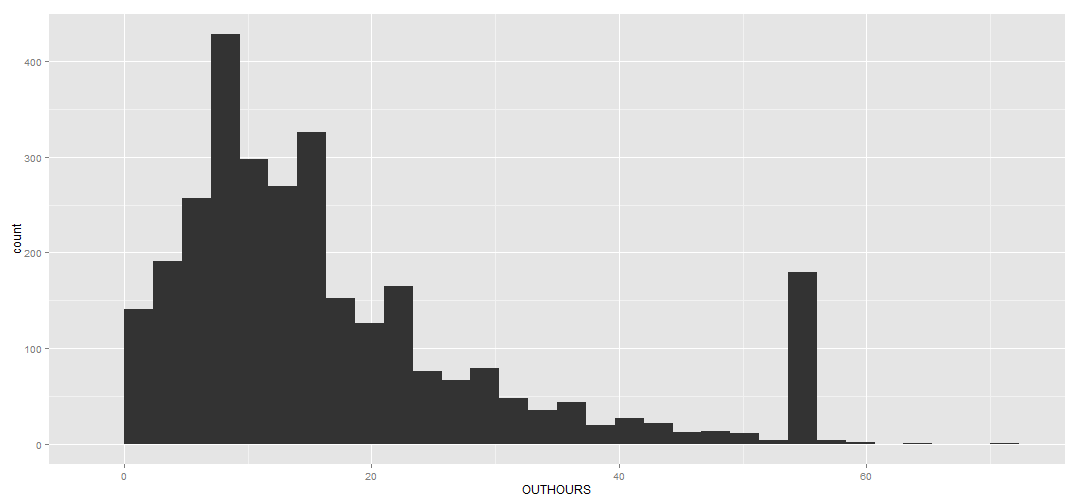
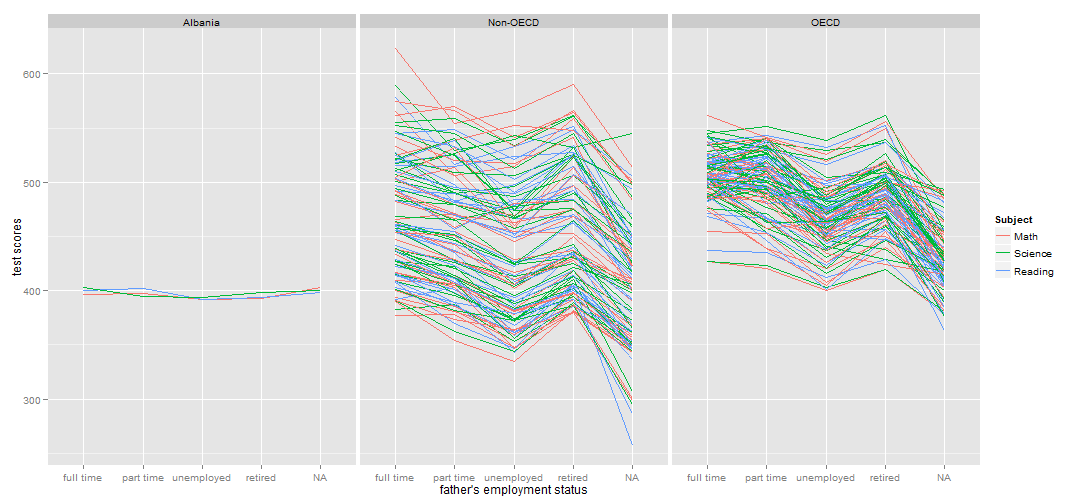
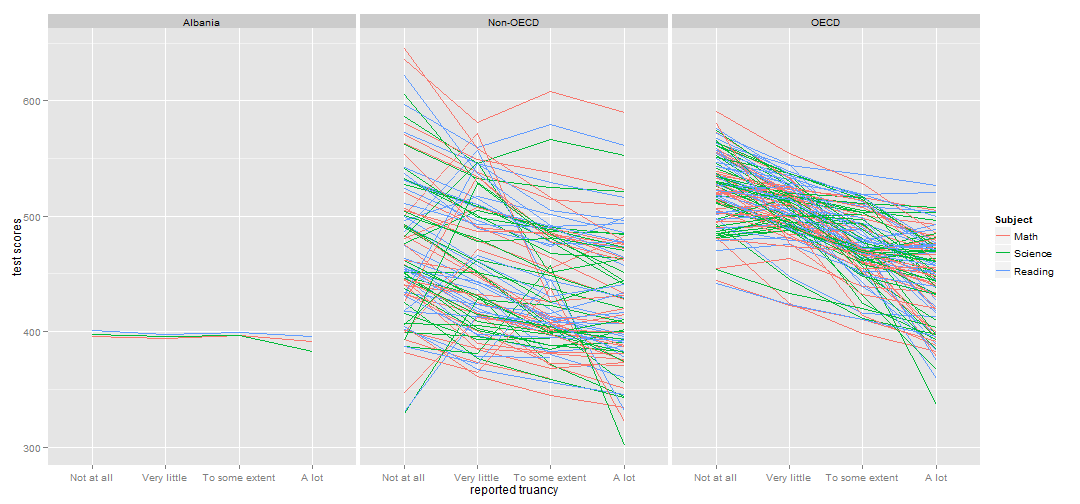
- Albania is weird; see below.
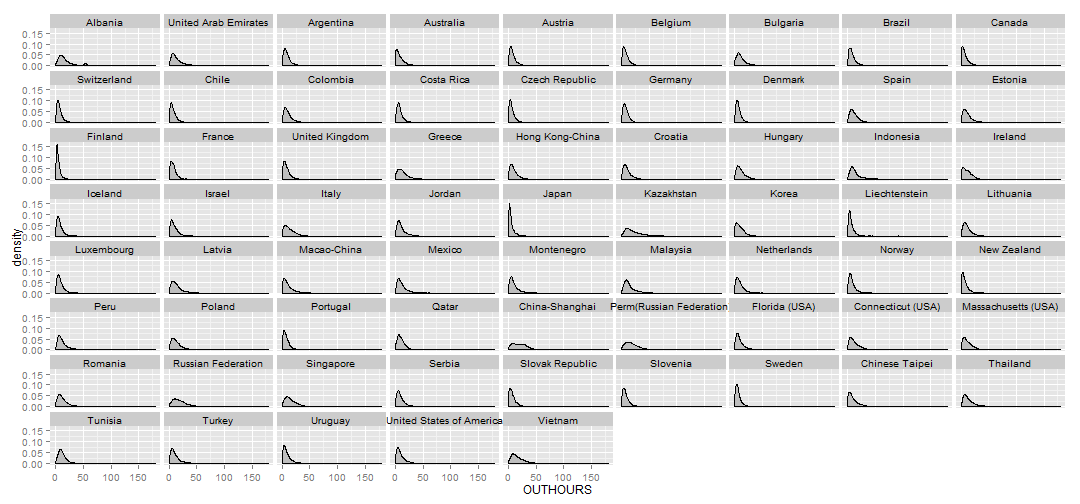
- Individual variability was a much larger factor than any single covariate.
.width = 1

data_small <-
  student2012 %>%
  select(OECD, CNT, OUTHOURS) %>%
  filter(!is.na(OUTHOURS))

ggplot(mapping = aes(x = OUTHOURS)) +
  scale_x_continuous(name = "out of school study time (hours)", limits = c(0,60)) +
  scale_y_continuous(name = "density") +
  geom_histogram(
    mapping = aes(y = ..density.., fill = OECD),
    binwidth = .width,
    data = data_small %>% filter(OECD == "Albania")
  ) +
  scale_fill_manual(
    values = "black",
    breaks = "Albania",
    guide = guide_legend(title = "")
  ) +
  geom_line(
    mapping = aes(group = CNT, color = OECD),
    stat = "density",
    alpha = 0.3,
    data = data_small %>% filter(OECD != "Albania")
  ) +
  scale_color_discrete(
    guide = guide_legend(
      title = "Other Countries",
      override.aes = list(alpha = 1)
    )

  ) +
  scale_colour_manual(values = c("#f4a582", "#92c5de")) + guides(colour = guide_legend(override.aes = list(alpha = 1)))